This study is a comparative study of two particular types of visualization techniques in detail.
We chose to study the map-based visualization and the bubble charts because they had been the most fascinating visualizations throughout this study. We are going to compare those two types on many factors.
Defining the visualizations
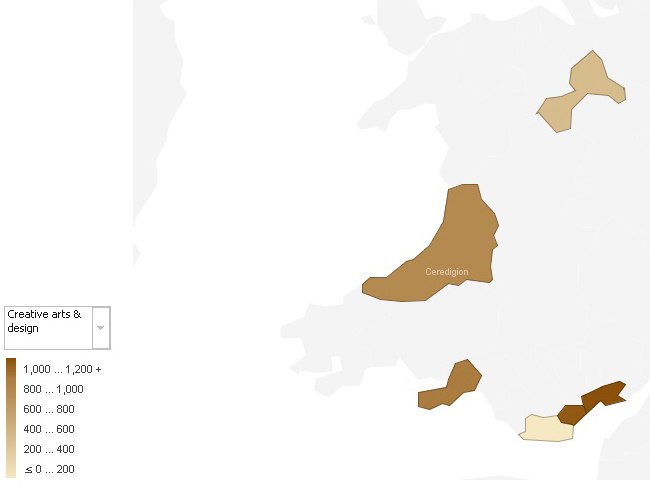
A thematic map is a type of map or chart especially designed to show a particular theme connected with a specific geographic area. These maps can portray physical, social, political, cultural, economic, sociological, agricultural, or any other aspects of a city, state, region, nation or continent....
Read more
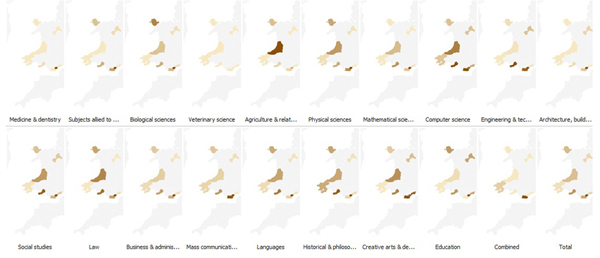
This study is about the production and the description of some advanced visualization charts related to the higher education in South West Wales. Some real data had been made available to complete this task and the objective is to get some meaningful and interesting insight about the data.
The tool used is IBM Many Eyes. It’s a web service that lets user upload data sets and can turn them into various visualizations. There were a lot of choices but only advanced visualization types (especially maps) had been highly recommended rather than basic charts. Further, graphs that show rises and falls over time had to be avoided as the provided data was not time oriented. So the five visualization types demonstrated here are block histograms, bubble charts, maps, matrix charts and tree maps....
Read more